Bin continuous data using quantiles.
Usage
rbin_quantiles(
  data = NULL,
  response = NULL,
  predictor = NULL,
  bins = 10,
  include_na = TRUE
)

# S3 method for class 'rbin_quantiles'
plot(x, print_plot = TRUE, ...)
Arguments
- data
A
data.frameortibble.- response
Response variable.
- predictor
Predictor variable.
- bins
Number of bins.
- include_na
logical; if
TRUE, a separate bin is created for missing values.- x
An object of class
rbin_quantiles.- print_plot
logical; if
TRUE, prints the plot else returns a plot object.- ...
further arguments passed to or from other methods.
Examples
bins <- rbin_quantiles(mbank, y, age, 10)
bins
#> Binning Summary
#> -----------------------------
#> Method Quantile
#> Response y
#> Predictor age
#> Bins 10
#> Count 4521
#> Goods 517
#> Bads 4004
#> Entropy 0.5
#> Information Value 0.12
#>
#>
#> cut_point bin_count good bad woe iv entropy
#> 1 < 29 410 71 339 -0.483686036 2.547353e-02 0.6649069
#> 2 < 31 313 41 272 -0.154776266 1.760055e-03 0.5601482
#> 3 < 34 567 55 512 0.183985174 3.953685e-03 0.4594187
#> 4 < 36 396 45 351 0.007117468 4.425063e-06 0.5107878
#> 5 < 39 519 47 472 0.259825118 7.008270e-03 0.4383322
#> 6 < 42 431 33 398 0.442938178 1.575567e-02 0.3899626
#> 7 < 46 449 47 402 0.099298221 9.423907e-04 0.4836486
#> 8 < 51 521 40 481 0.439981550 1.881380e-02 0.3907140
#> 9 < 56 445 49 396 0.042587647 1.756117e-04 0.5002548
#> 10 >= 56 470 89 381 -0.592843261 4.564428e-02 0.7001343
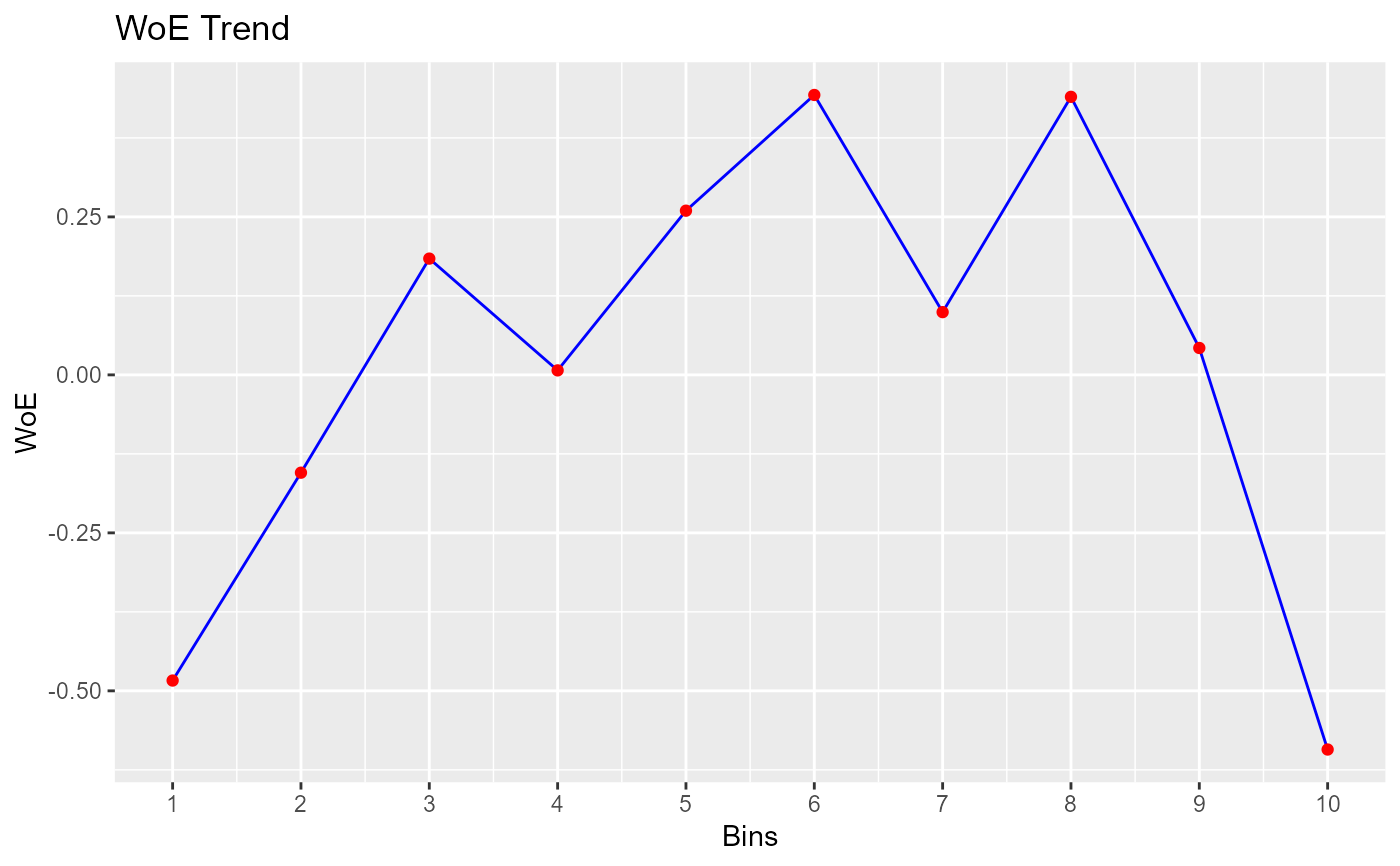
# plot
plot(bins)