Bin continuous data using the equal frequency binning method.
Usage
rbin_equal_freq(data = NULL, response = NULL, predictor = NULL, bins = 10)

# S3 method for class 'rbin_equal_freq'
plot(x, print_plot = TRUE, ...)Examples
bins <- rbin_equal_freq(mbank, y, age, 10)
bins
#> Binning Summary
#> ------------------------------------
#> Method               Equal Frequency
#> Response             y
#> Predictor            age
#> Bins                 10
#> Count                4521
#> Goods                517
#> Bads                 4004
#> Entropy              0.5
#> Information Value    0.11
#>
#>
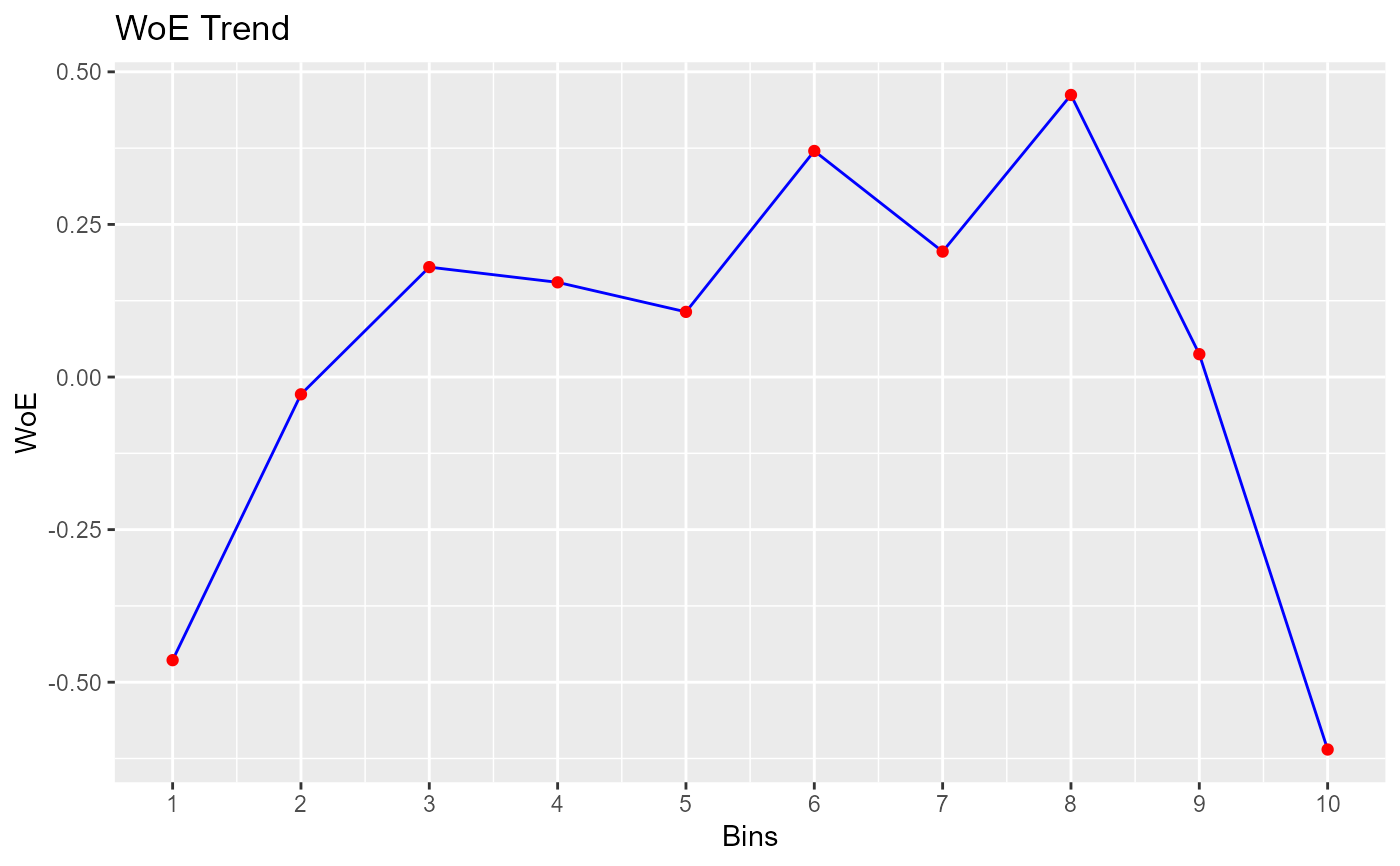
#>    lower_cut upper_cut bin_count good bad  good_rate         woe           iv
#> 1         18        29       452   77 375 0.17035398 -0.46388566 2.564352e-02
#> 2         29        31       452   53 399 0.11725664 -0.02833676 8.116094e-05
#> 3         31        34       452   44 408 0.09734513  0.18007127 3.023706e-03
#> 4         34        36       452   45 407 0.09955752  0.15514443 2.266308e-03
#> 5         36        39       452   47 405 0.10398230  0.10673320 1.092922e-03
#> 6         39        42       452   37 415 0.08185841  0.37035434 1.188083e-02
#> 7         42        46       452   43 409 0.09513274  0.20550877 3.899674e-03
#> 8         46        51       452   34 418 0.07522124  0.46211464 1.785222e-02
#> 9         51        56       452   50 402 0.11061947  0.03742282 1.380079e-04
#> 10        56        84       453   87 366 0.19205298 -0.61028105 4.691227e-02
#>      entropy
#> 1  0.6585139
#> 2  0.5214234
#> 3  0.4605229
#> 4  0.4675914
#> 5  0.4814936
#> 6  0.4086938
#> 7  0.4533741
#> 8  0.3851129
#> 9  0.5017816
#> 10 0.7057464

# plot
plot(bins)
